
A long, long time ago in a land before dev tools, there lived all of its predecessors. These ancestors were more basic and didn't offer the wealth of tools we enjoy today. But, they certainly paved the way!
The beginning
Section titled The beginningHow could developers view code in their browsers in the early nineties?
They could check out view source (see how to open view source here).
They could place alert() boxes throughout their code to test JavaScript. This wasn't great though, because alerts cannot display complex objects like functions. Also until the alert box(es) are gone, no other tabs or windows can be used.
Some got into the habit of commenting out code and then uncommenting it, to see if there was any difference in outcome.
It seemed like there was work to do...
The middle
Section titled The middleLater in the nineties, a better way to debug HTML came along in the form of this live DOM (document object model) viewer page by Hixie. The page doesn't seem to working currently. When working, any HTML entered into the first text area is parsed and appears in a visual DOM tree right underneath. Slightly further down it shows the rendered view.
Being able to see the DOM was a really important step to understanding how browsers interpret HTML. In the early 2000s, there were a number of people working on tools to improve the useful ability to visualise the DOM, in addition to CSS and JavaScript.
One of these tools, named Firebug, gained quite a bit of ground. First released in 2006, it existed as an addon (plugin) offered within the Firefox browser itself. The addon served as an extension to its browser software (first released in 2002). To learn more, see this blog post on Firebug. On this page, there are links to videos that offer a peek at what Firebug was like to use.
Only a few days after Firebug's release came Web Inspector. This was bundled directly into the Safari browser. Check out a picture of Web Inspector here. This tool also offered the ability to debug HTML, CSS, and JavaScript!
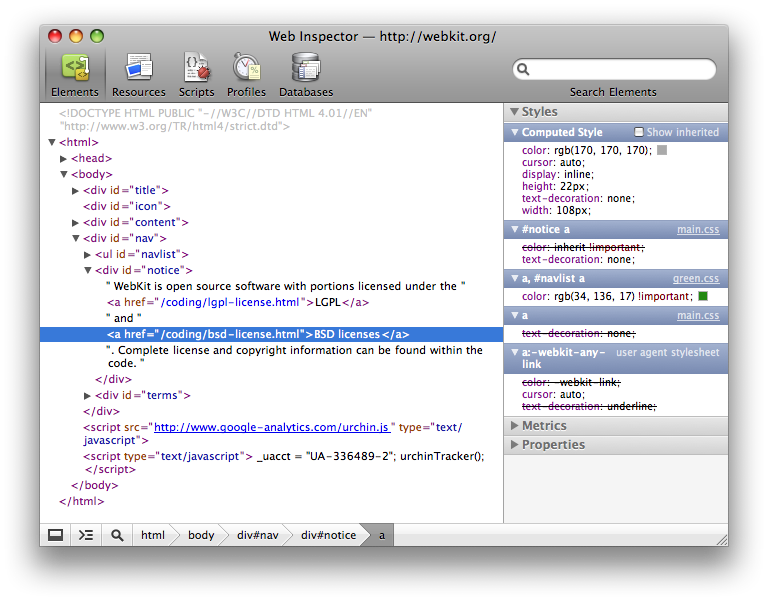
By 2010, the Chrome browser (released in 2008) had added the ability to right click a page, choose "Inspect element", and open dev tools.
From the early 2010s onwards, browser dev tools went from strength to strength. Things like remote debugging of mobile devices, performance panels, and audit panels (plus a lot more) were added. Nowadays, even Node.js can be debugged in dev tools.
The end
Section titled The endOk so don't worry, there is no end in sight to the dev tools story!
Who knows what developer tools will look like in the future? Almost two decades since these tools first began to appear, major browsers are still actively developing them. And, there is no standards body dictating what the tools should do. This means browser makers are pretty much free to add to their tools whatever they like. When and what is added depends quite strongly on what the browser makers' priorities are.
Some web users choose a browser based on whether their own values line up with that browser's priorities. For example, any one browser might lean more towards offering more security to its users, becoming more performant, or more accessible etc. That's a topic for another blog post though…